In practice, the magnitude of a celestial object is measured in certain wavelengths or colors using filters. This is because information about the color of stars is very useful to astronomers and gives them information about the surface temperature of a star.
The surface temperature of a star determines the color of light it emits. Blue stars are hotter than yellow stars, which are hotter than red stars. A hot star like Sirius, with a surface temperature of about 9,400 K emits more blue light than red light, so it looks brighter through a blue filter than through a red filter. The opposite is true of a cooler star such as Betelgeuse, which has a surface temperature of about 3,400 K. Betelgeuse looks brighter when viewed through a red filter than when viewed through a blue filter.
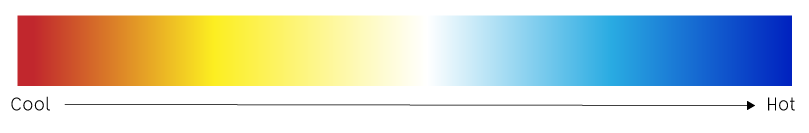
Color temperature scale
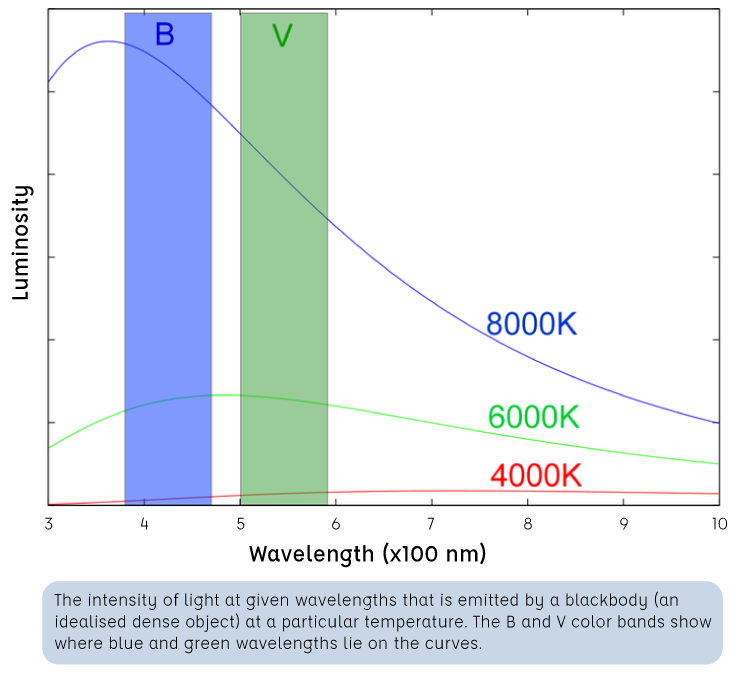
The color index of a star is the difference between the magnitude of the star in one filter and the magnitude of the same star in another filter. Any filters can be used for color indices, but some of the most common are B - V and V - R. B is blue wavelengths, V is green wavelengths and R is red wavelengths. Remember that magnitudes decrease with increasing brightness, so if B - V is small, the star is bluer (and hotter) than if B - V is large.
For example, for a star with B = 6.7 and V = 8.2, the magnitude in the B filter is brighter than the magnitude in the V filter, and B - V = -1.5. For values of B = 6.7 and V = 5.8, B - V = 0.9, and the star emits more green light than blue (this star would appear white).
The video below explains how a star's color is related to its temperature, and why we don't see green stars: