- A computer with spreadsheet software
- Supernova data - SN2016bkv activity spreadsheet
Plotting a Supernova Light curve
Summary
Use measurements from an exploding star to investigate cosmic distances
Goals
Students will plot and analyze observational data to demonstrate and understand how the brightness of the supernova changes over time.
Learning Objectives
- Further your understanding of the causes and effects of supernova
- Plot a photometric curve using observational data
- Interpret your graph and recognize the way the supernova is changing
- Understand how and why astronomers study the varying brightness of supernovae.
Planning
Background
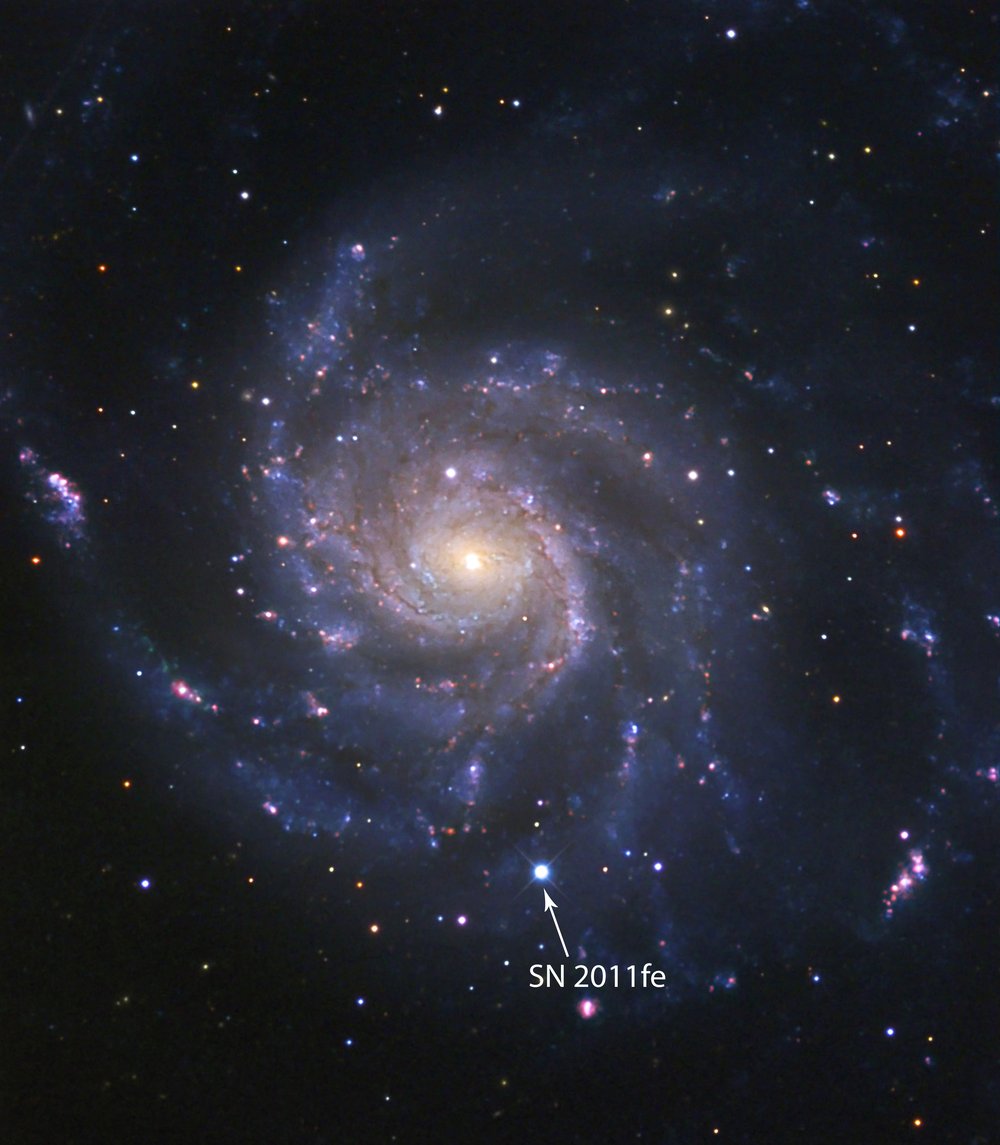
A supernova is a violent explosion marking the abrupt end of a massive star’s life. They are amongst the most energetic events in the Universe and are so bright they can briefly outshine an entire galaxy.
The death of a massive star is an exciting event, but there are several important reasons for scientists to study them: Supernovae (or supernovas) can help us untangle the evolution of galaxies, planetary systems and even life on Earth; they can reveal the origins of the Universe’s heavy elements, including the iron in your blood and every ounce of gold on the planet; and it was these super-luminous events that helped expose the expansion of our Universe.
Supernovae come in different flavours that come from different kinds of stars, have different kinds of explosions and produce different kinds of remnants. There are two main types of supernovae, the Type I and the Type II.
Type II
The most common are type II supernovae, which are produced when massive stars die. The conversion of hydrogen into helium at the core of a star releases energy in the form of photons, and this light pressure pushes against the force of gravity trying to pull the star in on itself. If the star is more than 8 times the mass of the sun, it can fuse heavier elements at its core, all the way up to iron, when the fusion reaction takes more energy than it produces. Then the outer layers of the star collapses inward and the star detonates as a Type II supernova. Depending on the mass of the star, this can result in a neutron star, a black hole or without leaving a trace.
Type I
Type I supernovae are created by pairs of stars (called binary stars), when one star in the pair is a white dwarf, the long dead remnant of a main sequence star like our sun and a companion which can be any other type of star. If the stars are close enough together, the white dwarf can steal matter from its partner. When the stolen amount reaches 1.4 times the mass of the sun, the white dwarf explodes as a supernova.
Find out more about supernovae on LCO’s Space Book
Instructions
A supernova is the explosive death of a massive star. Although they only burn for a short amount of time, supernovae can tell us a lot about the Universe, including how to measure distance in space. In this activity you will plot the changing brightness of the object and interpret your data to study how these objects evolve.
The supernovae we will be investigating in this activity are all outside our Milky Way galaxy, in distant galaxies.
Download your own supernova data as a .txt or .dat, or use our pre-made spreadsheets with data for supernovae:
- If you download the excel spreadsheet, jump to Step 4.
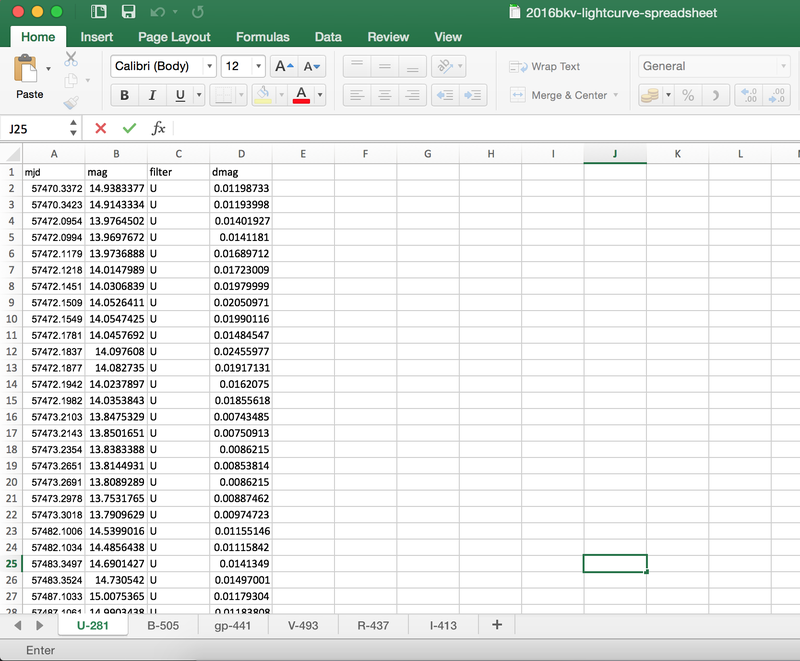
If you downloaded your data as a text file (.txt or .dat) you will need to open it in your spreadsheet software (this guide is based on Microsoft Excel) and separate the data into columns. Do this by selecting data>text to columns>delimited
- The data will need to be separated into columns as shown below:
- A: MJD (Modified Julian Date)
- B: Mag (Magnitude, or brightness)
- C: Filter (e.g. 'V' which stands for 'visible', 'U' stands for 'Ultra-violet')
- D: Dmag (Error on magnitude)
- Order your spreadsheet by Filter. Delete all rows that do not have the filter code 'U', this will leave us with data based on Ultra-violet light (if you are using the example file, the data has already been separated into different tabs).
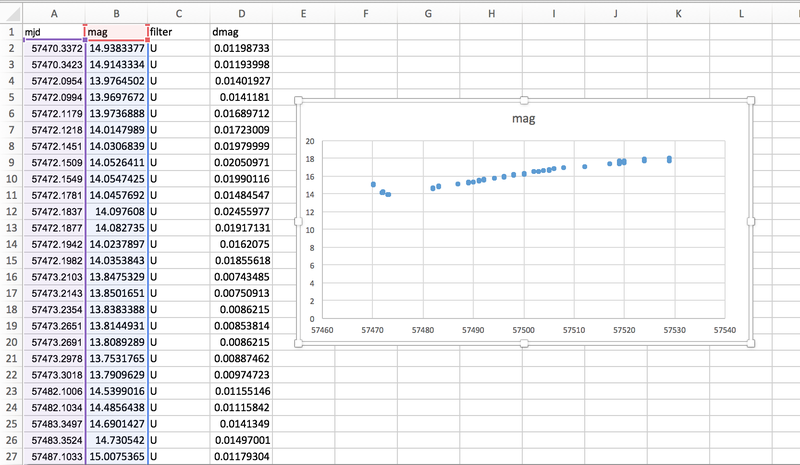
- In this activity you will be plotting the change in the supernova magnitude (brightness) over time. To do this, make a scatter plot of the date (MJD) and magnitude (mag). You can highlight both columns by pressing CMD on a Mac, or CTRL on a Windows device, then select Chart > Marked scatter plot.
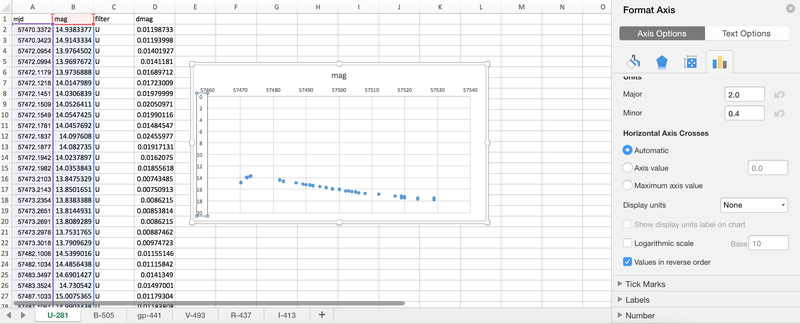
- Lower magnitude values mean an object is brighter. Click on the magnitude axis and select Values in reverse order to show this clearly.
- You should now have a plot showing the supernova brightness over time. If necessary, alter the min and max axis values to clearly show your plot. To do this, double click on your axis values until the dialogue box appears.
- To finish we need to add error bars, to show any uncertainty in our measurements. The errors on magnitude have already been calculated and can be found in the column labelled Dmag.
- Click anywhere on your plot and select Chart Design>Add Chart Element>Error Bars>More Error Bar Options
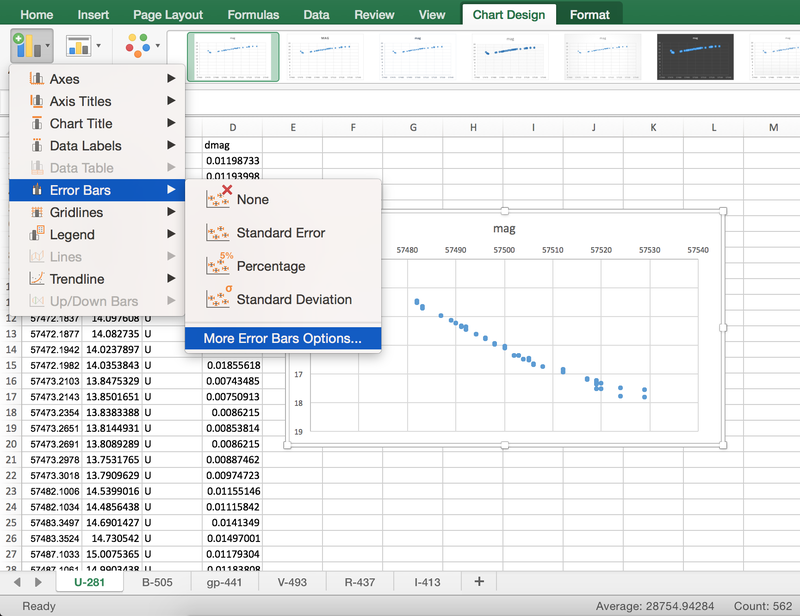
- Make sure Both directions are selected on the Error Bar dialogue box, then select Custom: Specify Value. Select the Dmag column for both the positive and negative values.
- Repeat steps 3 - 9 for each filter in your supernova data file
Conclusion
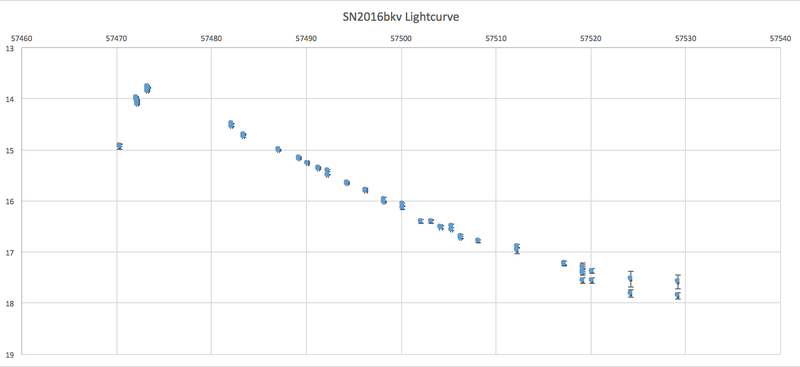
You should now have a solid light curve showing the change in brightness of this supernova over time. Congratulations!
Evaluation
- How has the brightness of the supernova changed?
- What does this light curve show us?
- What has caused the supernovae brightness to change?
- How would the curve look if
- the supernova maintained a constant brightness?
- the supernova brightened over time?
- the supernova brightened and dimmed periodically?
Next Steps
If you are using the SN2016bkv spreadsheet, data taken with each filter has been added as a different tab. Follow the steps in the activity above for each tab. You may need to cut down the data due to observation gaps. Double click on the x-axis (MJD) and change the Maximum (Bounds) to 57550.0. Do this for all filters for a fair comparison.
Compare the lightcurves, do they all appear to show the same behaviour? If not, why may this be?
More data
We have more datasets obtained by the LCO Supernova Research Group, which you can plot using the same method. The data are from real telescopes, and are subject to different atmospheric and weather conditions. The results you will get may be quite different.

Age
- 12-16
- 17-18
- All ages
Duration
Medium (30-60 mins)